- Research
- Open access
- Published:
Attack detection in water distribution systems using machine learning
Human-centric Computing and Information Sciences volume 9, Article number: 13 (2019)
Abstract
The threat to critical water system infrastructure has increased in recent years as is evident from the increasing number of reported attacks against these systems. Preventative security mechanisms are often not enough to keep attackers out so a second layer of security in the form of intrusion detection is paramount in order to limit the damage of successful attacks. In this paper several traditional anomaly detection techniques are evaluated in the context of attack detection in water distribution systems. These algorithms were centrally trained on the entire feature space and compared to multi-stage detection techniques that were designed to isolate both local and global anomalies. A novel ensemble technique that combines density-based and parametric algorithms was also developed and tested in the application environment. The traditional techniques had comparable results to the multi-stage systems and when used in conjunction with a local anomaly detector the performances of these algorithms were greatly improved. The developed ensemble technique also had promising results outperforming the density-based techniques and having comparable results to the parametric algorithms.
Introduction
The increased popularity of cyber physical systems (CPS) in recent years is evident in the variety of different applications where they are deployed [1,2,3,4,5]. Water distribution systems (WDS) have also embraced the convenience and flexibility of these CPS where digital computation and networking form an integral part of the monitoring and control of physical processes. The deployment of these smart water networks is paramount in the development of the envisioned smart cities of the future [6]. The added water management functionality introduced by CPS corresponds with an increase of vulnerability to cyber-attacks from intruders with malicious intent. This is largely due to the fact that these systems are heavily dependent on computer networks meaning that an attacker can use conventional techniques to penetrate this network which would give them access to the supervisory control and data acquisition (SCADA) system [7]. Adequately securing smart city applications will be paramount in order for them to become a reality in future [8].
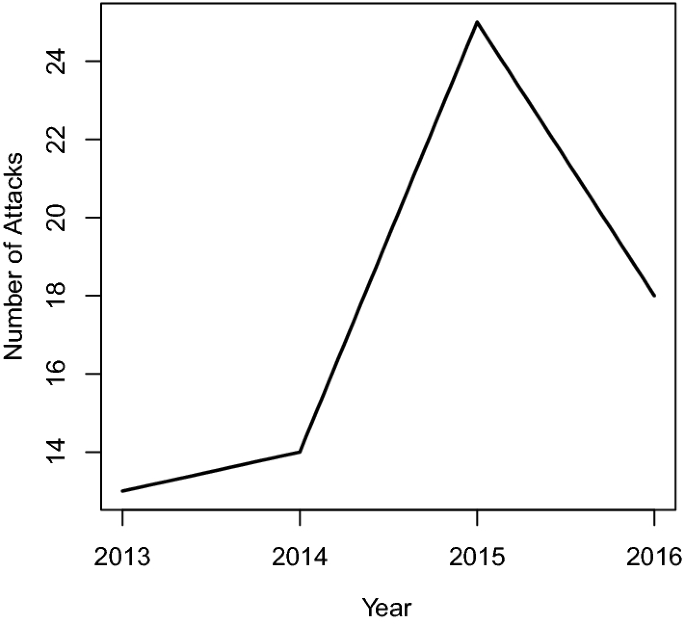
There has been a steady increase in the number of reported attacks against critical water system infrastructure in recent years (Fig. 1) and they have been reported to be in the top four of the most targeted critical infrastructure sectors [9,10,11,12]. The devastating impact of a successful attack in critical water system infrastructure could be long lasting with major social and financial implications so the protection of these systems should not be neglected when embracing the smart technologies of the future. An example of the impact of such an attack is evident when looking at the successful breach of the Maroochy water treatment facility in Queensland, Australia. A disgruntled contractor was turned down for a position by the municipality and in retaliation he launched devastating attack on the facility using insider knowledge he gained while being part of a team that installed upgrades to system [7]. The attacker was able to remotely seize control of 150 pump station and by the time he was apprehended local water ways had been contaminated with around 150 million litres of untreated sewage.
The Maroochy water treatment facility did have preventative security mechanisms in place but the attacker was able to use his intimate knowledge of the system to bypass them. This shows that these preventative measures alone are not adequate to protect critical infrastructure applications so a second layer of security is required. More sophisticated attacks than Maroochy would still however very difficult to detect because an attacker with sufficient knowledge about the system would be able to launch stealthy attacks that are able to fool the built-in fault detection (FD) mechanisms of these systems [13]. The authors in [14] for example were able to show that an insider with physical access to the system would be able to launch a devastating man-in-the-middle attack that would be undetectable by the FD mechanism. A robust intrusion detection systems (IDS) is still however able to detect these attacks even when the attacker attempts to go unnoticed [13].
IDS are deployed in response to the threat of normal security mechanisms failing to prevent an attacker gaining unauthorised access to the protected system. In this case the system would be able to detect whether or not the system has been breached which could prevent the attacker from causing a substantial amount of damage. The critical nature of WDS and frequency of attacks against these systems in recent years means that IDS are of equal importance to preventative security mechanisms. This is especially true when considering the fact that the key security goals when protecting WDS are to ensure that the system is able to carry out it’s mandate by preventing, detecting or surviving cyber attacks [15]. The last two goals are linked to IDS in the broader network security architecture which shows how important this second line of defence is in these systems.
Some of the common attacks against WDS are (1) compromising the sensors or actuators (physical layer), (2) attacking the links between the various devices (datalink layer), and (3) a direct attack to compromise the entire SCADA system (SCADA layer) [16]. If an attack on the SCADA layer is successful it becomes very difficult to detect because it is on this level where intrusions are detected. When considering the attack on the Maroochy water treatment facility it becomes evident that this was an attack on the SCADA layer meaning it would have been nearly impossible to detect in the SCADA network. Cyber-physical systems incorporate both corporate and SCADA networks and the attacker was able to seize control of the SCADA system through the corporate network [17]. In this case the useful IDS system would have been the one implemented in the corporate and not the SCADA network. This IDS would need to form part of a larger network security architecture which includes strong network security policies which take into account the critical nature of the system being protected. From the perspective of the SCADA system an efficient logging system would be very useful once an attacker takes control of the system. This is because an attacker would be able to manipulate or even turn off all of the systems security mechanisms. An efficient logging system however would have allowed administrators to trace the root of the problem once the system started misbehaving.
WDS are in essence Industrial Control Systems (ICS) which consist of four key elements: (1) the physical process, (2) actuators, (3) sensors and, (4) a controller [18]. The physical process changes depending on the application scenario, for example in power grids it is electromagnetics and in water systems it is fluid dynamics. This is what distinguishes these ICS from each other even though they are structured in a similar way and components (2) to (4) are all vulnerable to attacks that could have a devastating impact on the entire system. Simple attacks like Denial-of-Service (DoS) attacks will be similar across all ICS and also easier to perpetrate and detect [19]. More advanced deception attacks will be application specific because they require an attacker to have an intimate knowledge how the system works. Should the attacker want to launch stealthy attacks they would also need knowledge about the system dynamics as it pertains to the physical process. These more advanced attacks are more difficult to perpetrate and detect but they have far more devastating consequences than the simpler ones. The differences in these system dynamics also means that an algorithm that works well in one critical infrastructure sector will not necessarily work well in another. This is because knowledge about the physical system being controlled is key in both executing an attacking and protecting the system [20]. The performances of these IDS is thus going to be application specific.
IDS generally fall into two broad categories: those that are signature based and those that are behaviour based [21]. Signature based intrusion detection provides a fast way to detect known attacks based on specific patterns that can be attributed to those attacks. Behaviour based intrusion detection, also known as anomaly detection (AD), provides greater detection generality in that it can detect previously unknown attacks by analysing sensed data or traffic patterns to determine which instances deviate from the norm. A disadvantage of Signature based methods is that they are unable to detect unknown attacks while the AD schemes are generally less accurate and produce many more false positives. This paper focuses on the latter group of methods because the former are more reactive in that they rely on analysing attack sequences after an attack has potentially already caused a substantial amount of damage. The ability to detect unknown attacks in critical infrastructure applications is thus a necessity as can be seen by the impact of not swiftly detecting the attack on the Maroochy water treatment facility.
In this paper we compare a number of popular anomaly detection schemes that are based on machine learning using the battle of the attack detection algorithms (BATADAL) dataset [22]. The BATADAL competition produced a number of attack detection algorithms that used multi-stage strategies in an attempt to isolate both local and global anomalies. The main contributions of the work presented in this paper are as follows:
-
1.
We evaluate whether conventional algorithms trained on the entire feature space in a centralised manner would be able to produce better or comparable results to the multi-stage systems proposed for the competition.
-
2.
We also propose a novel ensemble detection scheme that leverages the scalability of density based techniques and the accuracy of parametric algorithms in order to produce a more robust system that minimises the drawbacks of the conventional schemes.
The rest of the paper is organised as follows: First a summary of the BATDAL competition is presented and its results are discussed to give context to the work presented in this paper “Anomaly detection” section. The approach taken is then discussed and the algorithms used in this paper are introduced followed by the proposal of a novel ensemble technique for anomaly detection. The results of our experiments are then presented and discussed (“Results” section). Finally some observations from the results are discussed (“Observations” section) and the paper is concluded (“Conclusion” section).
Anomaly detection
In this section, some related work is discussed and then a brief overview of the BATADAL competition and its results are given. This then leads to a discussion about the traditional techniques implemented in this paper and then finally the proposed ensemble technique is introduced.
Related work
An anomaly is not necessarily the result of an attack and as such anomaly detection algorithms can be used to evaluate situations the deviate from the normal operating conditions of the system such as water loss or normal system faults [7]. The authors in [23] used wavelet change-point detection that uses the continuous wavelet transform to detect water loss in WDS. The system is successfully able to detect water leaks in the application scenario but the sensitive nature of the algorithm means that it has the potential produce many false positive by detecting a normal process as an abrupt change. The authors in [24] propose a ensemble leakage detection technique that uses a convolution neural network (CNN) and support vector machine (SVM) for detection and graph based localisation technique to find the location of the leak. The system yielded good accuracies for both detection and localisation although it still struggled with one-dimensional signals.
Power grids are as vulnerable as WDS and the electricity sector is consistently ranked the most targeted critical infrastructure sector by the Industrial Control Systems-Cyber Emergency Response Team (ICS-CERT) [9,10,11,12]. Several anomaly detection schemes have been proposed in an attempt to mitigate this threat [25,26,27]. The authors in [25] proposed a hierarchical framework for anomaly detection in large-scale smart grid distribution systems. The proposed system uses smart meter data and a generative anomaly detection model which accounts for missing data. Thy sytem was verified using data from a large utility company and yielded promising results. The authors in [26] proposed the use of an innovative reputation system for the detection of false data injection attacks in smart grids using a distributed host-based system. Smart grid systems have inbuilt fault detection mechanisms which automatically correct infrequent anomalous data so an attacker is required to persistently inject false data into the system in order to bypass this mechanism. The authors used this attacker behaviour to build their reputation system which was accurately able isolate anomalies as verified by simulations. Like WDS however an attacker can launch stealthy attacks in an attempt to fool the IDS by mimicking the process dynamics of the system. The authors in [27] propose a solution to this problem by leveraging the power of machine learning. The system first uses principal component analysis (PCA) the reduce the dimensionality of the data and then depending of the nature of the data either supervised SVM or a semi-supervised outlier detection technique based on the Gaussian distribution probability density function. Although both methods yielded promising results, supervised learning is not always practical in anomaly detection systems because of the infrequency of anomalous events [7].
The battle of the attack detection algorithms
The BATADAL competition involved a number of research teams who proposed attack detection algorithms for the fictional C-Town water distribution network [22]. The competitors were provided with three datasets, one with normal data (BATADAL_normal) and two that included a number of attacks (BATADAL_train and BATADAL_test). The BATADAL_train dataset was partially labelled and was meant to be used for training purposes while BATADAL_test wasn’t labelled at all and was used to evaluate the proposed algorithms. In this paper we assumed that the BATADAL_train dataset was fully labelled and can thus be used for training and cross-validation purposes.
Seven teams [28,29,30,31,32,33,34] took part in the competition and all of the teams but two proposed multi-stage detection algorithms. One of the teams that didn’t produced a model based technique that simulated the hydraulic processes using EPANET and used the error between the expected and actual values to determine whether or not an attack had occurred [28]. This was the only model-based technique proposed for the competition and it was incidentally also the most accurate. The authors in [22] however argue that the implementation of this technique in real-world systems will face many challenges because of the volatile nature of these systems. The second team [31] opted for a decentralised approach by splitting the network into district metered areas (DMA) and predicting the water level of each tank using recurrent neural networks (RNN). As with the model based technique the error between the expected and actual values were used to find anomalies. The remaining competitors all proposed multi-stage systems with the majority opting for a simple control rule violation check as part of the first detection stage.
Traditional techniques
The main reason cited for using multi-stage detection techniques was to enable the algorithms to detect both content and contextual anomalies [22]. The former implies specific components of the system are not operating within their permissible operating range while the latter identifies the broader system as behaving in an unexpected manner based on historical data. In this paper we evaluate a number of popular anomaly detection techniques in order to determine whether or not they are able to detect both content and contextual anomalies. This is done without the aid of a dedicated content anomaly detection technique on the fully centralised feature space. The algorithms used for this purpose can be placed into three broad categories, those that are density based, parametric and classification algorithms.
It should be noted that some of the schemes proposed for the BATADAL competition have stages which also form part of the broad categories discussed in this section. The major distinction is that the schemes in this section are popular anomaly detection schemes which weren’t considered for the competition that don’t form part of multi-stage systems in the application environment. In this way we are able to determine whether or not this conventional techniques are able to produce similar or better results than the multi-stage systems when trained on the entire feature space without a dedicated content anomaly detector.
Density-based algorithms
One of the most popular outlier detection algorithms is the local outlier factor (LOF) algorithm which was proposed by Breunig et al. [35]. The algorithm assigns each data instance a score (the outlier factor) which is a measure of how much of an outlier it is relative to its neighbours. Equation (1) describes the local reachability distance of an object p which is intuitively the inverse of the average reachability distance of that object relative to its K nearest neighbours. The local outlier factor can then be determined using (2) which is the average of the ratio of the local reachability distance of an object p and it’s K nearest neighbours. A LOF value that is approximately equal to one means that the object is not an outlier and those much larger than one are considered outliers.
The subspace outlier degree (SOD) algorithm is a variation of the shared nearest neighbours (SNN) algorithm that was specifically designed to detect outliers in high dimensional data [36]. The data is first projected onto a subspace which is an axis-parallel hyperplane with a dimensionality that is smaller than that of the original feature space. Any point that significantly deviates from this new hyperplane is then considered an outlier. The measure used to ascertain deviation is the weighted Euclidean distance as shown in (3) where o is the object, v is the subspace defining vector and \(\mu \) is the mean of the reference set. The SOD can then be calculated using (4) which is the normalised version of (3) using the dimensionality. A SOD value that is approximately equal to zero means that the object is not an outlier and those much larger than zero are considered outliers.
Parametric methods
Parametric anomaly detection algorithms are those that make an assumption about the density distribution of the underlying data [7]. One of the most popular parametric methods is based on the Mahalanobis distance (MD) which is preferred over the Euclidean distance because it takes the variability and correlation of the variables into consideration [37]. The MD of an object \(x_i\) can be calculated using (5) where C is the variance-covariance matrix, \(\mu \) is the mean and T denotes the transpose operation. This method assumes that the underlying data follows the multivariate normal distribution and an object that has a large MD value is considered to be an outlier. A disadvantage of this method is that multicollinearity in high dimensional data leads a variance-covariance matrix that cannot be inverted meaning that the MD cannot be calculated.
Classification algorithms
The methods described in this section are model-based classification algorithms which use historical data to find a model that can be used to classify new objects as either normal or anomalous. Discriminant analysis (DA) is a classical statistical technique that can be used for both profiling and classification [38]. We have implemented both linear (LDA) and quadratic discriminant analysis (QDA) with the former being more popular in practice but because of the complex nature of the application the latter was hypothesised to have a better performance. While discriminant analysis is a classification algorithm it is also parametric because it uses the MD to separate different classes. This means that discriminant analysis suffers from the same drawbacks when dealing with high dimensional data. With respect the requirement that the data should approximately follow the multivariate normal distribution DA is quite robust and is still able to perform well even when this requirement is not met. When this requirement is reasonably met however DA has been found to be more accurate than many other popular classification algorithms such as logistic regression.
The intuition behind the one-class support vector machine (OSVM), or in fact any one-class classifier, is to draw a decision boundary around most of the positive class data points [39]. Any point that falls outside the decision boundary is then considered to be an outlier. The Gaussian kernel is more flexible and accurate than other decision boundaries but it requires more training data. This algorithm does not work well with high dimensional data or when there are large density variations in the positive class. The benefits of using a one-class classification is that only the positive class is required for training which determines the “normal” behaviour of the system. This pseudo-unsupervised approach means that the unbalanced data problem [40] is not an issue. A summary of the concepts discussed in this section is shown in Fig. 2.

Anomaly detection techniques
Proposed ensemble technique
We can make a few observations from the discussion above. Firstly, when the underlying density distribution of the data is known, parametric AD schemes will outperform all of the other data-driven algorithms. The problem with these algorithms though is that they aren’t applicable to high dimensional data because of multicollinearity. This means that dimensionality reduction is going to be paramount when trying to apply them to high dimensional data. The second observation is that even though QDA uses MD in it’s calculation it will outperform it by a significant margin owing to it’s more flexible decision boundary. Conversely, the linear decision boundary drawn by LDA is not enough to adequately capture the differences between the negative and positive examples.
The density-based algorithms on the other hand do not make any assumption about the underlaying density distribution of the data but they aren’t as accurate as the parametric schemes. By examining the density distribution of both algorithms when run on the BATADAL dataset, as shown in Fig. 3, we can see that the data approximates the skew normal distribution. This means that the outlier values produced by these algorithms can be used by parametric algorithms to classify data. The ensemble technique proposed in this paper takes into account the two observations discussed above. Firstly we want to reduce the dimensionality of the data fed into parametric schemes because they are not applicable to high dimensional data. Secondly, QDA is able to find a complex decision boundaries which leads to more accurate systems.

Density distribution of LOF and SOD
The proposed ensemble technique combines both SOD and LOF using QDA as shown in Fig. 4. As can be seen from the figure a datapoint is first run through both algorithms in parallel and the degree to which the value is an outlier is calculated using both (2) and (4). This density based phase of the proposed ensemble technique outputs two values, the LOF and SOD respectively. As discussed previously, an LOF and SOD value of much larger than one and zero respectively means that the datapoint is an anomaly. This is also evident when looking at the density distribution shown in (3). LOF will outperform SOD when run on low dimensional data and the opposite is true when considering high dimensional data. The proposed technique incorporates both of these values in order to create a more robust algorithm that leverages the advantages of the baseline algorithms.

Proposed ensemble technique
To find a more complex decision boundary, QDA is introduced to find a model that uses both values to classify the data. This was chosen over popular methods such as bagging and boosting normally used in ensemble classifiers in order to leverage the classification power of QDA. These traditional methods normally rely on the classification outputs of each of the algorithms which are then combined to produce more accurate results. The advantage of QDA is that it uses the outlier values produced by each algorithms to draw its own independent decision boundary. The density distribution of the data means that QDA will be able to be able to produce very accurate results.
The density-based techniques make use of the full feature space to calculate their respective values. QDA then takes in only two features irrespective of how large the original feature space was, meaning that the dimensionality of the data will never be a problem in this context. Ensemble techniques are usually better than their singular counterparts because a number of algorithms are working together overcome each others limitations [7]. While this is mostly true, it is not always the case so it is important to evaluate the proposed technique under varying conditions in order to ascertain its advantages and drawbacks.
Results
In this section the results of the BATADAL competition are compared to the traditional anomaly detection algorithms discussed in the previous section. Based on these results we propose an ensemble technique for anomaly detection that considers the disadvantages and leverages the advantages of these schemes in order to create a more robust algorithm. The traditional schemes are then tested in the cases where the dataset size is halved and also where some of the sensors produced noisy results. Finally we consider how well the traditional schemes would work if they were implemented as part of a multi-stage system. The BATADAL dataset was used because the competition had seven contestants who developed state-of-the-art algorithms that were all evaluated using the same performance metrics. This made it easier to adequately compare the performances of the implemented techniques without having to extrapolate from the results in published literature.
Normal dataset
In Table 1 the traditional algorithms were implemented on the BATADAL dataset and compared to the results of the competition as found in [22]. The table lists a number of performance metrics mostly calculated from the confusion matrix values which are the number of true positives (TP), false positives (FP), true negatives (TN) and false negatives (FN). These values are then used to calculate the precision also known as the positive predictor value (PPV), the specificity also known as the true negative rate (TNR) and the recall also known as the true positive rate (TPR). The \(F_1\) score is then calculated using (6) and the \(S_{CLF}\) is the mean of TPR and TNR. The time-to-detection (TTD) value is the difference between the time when an attack starts and when it is first flagged and it is used to calculate the \(S_{TTD}\) score as shown in (7). The overall performance score S used to rank the algorithms is calculated using (8) where \(\gamma = 0.5\).
It is worth noting that the \(F_1\) score and PPV were not in the original table, which is why the ranking score doesn’t consider them, but they were included here because they are popular performance metrics used to evaluate machine learning algorithms. The algorithms B1–7 in the table are those from the competition with the number indicating their original ranking. The performance score is biased towards detecting attacks such that an algorithm that just detected everything as an attack would get a score of 0.75. This is called the naive classifier in the table. This is done because the cost of not detecting an attack in the application scenario is much higher than the cost of false positives.
Looking at the table, the worst performing algorithms are OSVM and LDA and they have an S score of less than the 0.75 which would be achieved by the naive classifier mentioned above. Both algorithms however have better \(F_1\) scored than B5–7 (and the naive classifier) as a result of having a much high precision, which is the fraction of flagged instances which were correctly classified, than either of those algorithms. The density based techniques appear in the middle of the table with S scores in the mid to late 80s which is much higher than the naive classifier. These algorithms have a much higher number of FN than all the other algorithms that achieved S scores greater that 0.75. These techniques were still able to detect all of the attacks meaning that the high false negative rate is as a result of detecting attacks late and ending them early as can be seen from the \(S_{TTD}\) score which is also lowest of all the algorithms that beat the naive classifier.
The MD and QDA algorithms both have exceptional results with both achieving S scores in excess of 0.9 with QDA outperforming all of the algorithms with the exception of the only model based one. Both of these parametric methods thus fall into the cluster of high performing algorithms that include B1–4 from the competition. Even though the results of the competition were biased towards the detection of attacks, all of the algorithms that beat that naive classifier (with the exception of B5) have \(F_1\) scores in excess of 0.8 with the high performing algorithms all being above 0.88.
Performance of ensemble technique
The results of the proposed scheme when run on the BATADAL dataset can be seen in Table 1. It performs better than both density-based techniques but isn’t as accurate as QDA. It also has an S score higher than 0.9 making it part of the illusive high performing algorithm cluster. It has an almost identical performance to MD and the biggest difference with LOF and SOD is the TPR which had a seven point increase. These promising results show that the proposed scheme has better or comparable results to those found in the literature.
Reduced dataset
The BATDAL dataset provides hourly readings taken from the C-Town WDS over a period of many months. To see how robust the traditional techniques are the dataset was halved by taking readings every 2 h instead of every hour. In machine learning the more data one has typically results in a more accurate algorithm [41]. By halving the dataset we are evaluating how resistant the algorithms are to a change in dataset size. It is worth noting however that more data will not always result in a more accurate algorithm especially as it pertains to fixed size learners like the ones implemented in this paper. Processor limitations also mean that it is sometimes not feasible to simply throw data at a problem, meaning that more robust algorithms that aren’t solely dependent on the data size are required.
The results of running the tradition techniques on the reduced BATADAL dataset are shown in Table 2. Unsurprisingly QDA, which typically doesn’t need a lot of training data to yield good results, was not affected much by this change in data set size. It is the only algorithms that remained part of the high performing cluster of algorithms on this dataset. LDA, which was already struggling on the original dataset, had a slight decrease in S score owing largely to a sharp decrease (almost 10 points) in it’s \(S_{TTD}\) score. Surprisingly though, almost all of the other performance measures were higher this time around. The lower S score of MD was also highly influenced by it’s decreased \(S_{TTD}\) score as all the other performance metrics were only slightly lower.
The density-based techniques had moderate decreases with only LOF following the same pattern as the other algorithms and SOD having consistent decreases throughout. The most affected performance metric in both algorithms was the \(F_1\) score which was largely affected by the PPV which had a significant decrease in both algorithms. The reason for this can bee seen in the table when looking at the much larger number of false positives for both algorithms even though the dataset has halved in size.
In contrast to all the other algorithms, OSVM had a much better performance on this dataset than it did on the original one. It’s S score increased by almost seven percentage points and the main performance metrics used in BATADAL had a similar trajectory. The largest decrease was the PPV which dropped by almost forty points but this coincided with an almost twenty point increase in the TPR which thus resulted in a similar \(F_1\) score. Only QDA and MD managed to maintain their number of detected attacks from the original dataset with all the other algorithms detecting one less attack on this one.
Performance of ensemble technique
Unsurprisingly the proposed ensemble technique followed the same pattern as the two density based approaches because it combines the values of both algorithms. What wasn’t expected however was that it would have a moderately lower performance than LOF which beats it by one percentage point. In this case LOF still has a lower \(S_{TTD}\) score but it has a much higher TNR which corresponds to a higher \(S_{CLF}\) score. When looking at the TPR and PPV it is evident that the Ensemble technique is able to detect more anomalies than LOF in this scenario but this comes at a cost of an increased number of false positives in this scenario.
Noisy dataset
Noisy data is common in cyber-physical systems and can severely affect even physical model-based attack detection techniques [42]. Noisy data can cause, amongst other things, severe overfitting of the training data [41] which could adversely affect the results on the test dataset. In this section noise is added to the pressure sensor values to evaluate how resistant the implemented algorithms are to this. Gaussian noise with a mean of zero and standard deviation of two was applied to the pressure sensor values and the results of this on one of the sensors can be seen in Fig. 5. Gaussian noise was selected because it is a common way of modelling sensor measurement noise in ICS applications [43]. Notice that there is a spike in the normal sensor reading between October and November. These readings are from the first attack dataset and that spike corresponds to an attack that eventually led to an overflow of Tank 1. Looking at the noise readings it can be seen that the spike is no longer visible thus making it more challenging to detect that attack.

Noise applied to a pressure sensor
The results of running the tradition techniques on the noisy BATADAL dataset are shown in Table 3. QDA and MD were not affected much by this additional noise with both remaining part of the high performance cluster. Both however had an increase in the number of false negatives which resulted in a lower TPR. It is possible that these algorithms were not affected much by this noise because it follows the Gaussian distribution. Looking at Fig. 6 it is evident that the noisy signal of the pressure sensor much more closely approximates the normal distribution required by both algorithms than the original signal. The density-based algorithms had a similar reaction to the additional noise as they did to the reduced dataset with moderate decrease throughout and a much lower PPV. OSVM and LDA both had significant decreases in performance with both algorithms recording a sharp increase in the number of FNs and a corresponding decrease in the number of TPs.
Performance of ensemble technique
In this scenario, the ensemble technique edges LOF by a single percentage point in the rankings attributed mainly to it’s higher \(S_{TTD}\) score although it still has a much lower \(F_1\) score. As with the reduced dataset, the ensemble technique has a higher TPR but a lower PPV than LOF while consistently outperforming SOD. This again means that it is detecting more anomalies than LOF but it also has a much larger number of FPs as can be seen from the table.

Distribution of pressure sensor
Multi-stage systems
As mentioned previously most of the algorithms from the BATADAL competition implemented multi-stage systems in an attempt to isolate both local and global anomalies. The intuition is that some anomalies are only obvious when looking at the data from the context of local subsystems. This means the system as a whole may still be functioning as expected but specific subsystems could be behaving uncharacteristically in their local context. It is for this reason that in this section we explore how much of an impact adding a local detector would have on the implemented techniques.
A simple control rule violation check was found not to be adequate to isolate local anomalies because of the complex nature of the attacks which included several concealment tactics. It for this reason that a decentralised OSVM algorithm was preferred as the first detection stage in order to learn the expected behaviour of the different subsystems. While the original OSVM algorithm was implemented over the entire feature space, the decentralised approach has several of these algorithms running in parallel on subsets of the data which were determined using the dependencies provided with the dataset. From the dataset it is known which actuators are responsible for which tanks and which pressure sensors can be attributed to the different pump station.
The results of running the multi-stage detection techniques with decentralised OSVM as the first stage on the BATADAL dataset are shown in Table 4. From the table it is evident that the majority of the algorithms had significant improvements when compared to their original performance. The only exception seems to be QDA which already had the highest S score of all the data-driven algorithms. This could be an indication of a limitation of this approach in the application environment. The MD algorithm had a moderate S score increase of two percentage points making it slightly better this time around than that of algorithm B3 from the competition.
The density-based algorithms both surpass algorithm B4 to become part of the high performing algorithm cluster recording increases across most performance metrics. The biggest gain however came from LDA which had an S score increase of almost 10 percentage points outperforming both OSVM and B6 and detecting one more attack than it did on it’s own. Centralised OSVM also had a significant increases in the performance metrics recording the highest \(F_1\) score increase of all the algorithms. By using this multi-stage approach, all of the implemented algorithms were able to beat the naive classifier.
Performance of ensemble technique
The Ensemble technique is dependant on both density-based algorithms so it is unsurprising that it recorded a similar increases in performance. When paired with a local classifier it was able to surpass MD and was only narrowly beaten by B2 to place fourth overall. Looking at the base algorithms, it was again able beat SOD across all performance measures as it in all of the other datasets. It still had a higher number of false positives than LOF in this case but outperformed it in almost all the other performance measures, even registering a higher \(F_1\) score. The proposed technique also registered an S score that is within less than a half a percentage point of the top performing QDA algorithm.
Observations
Parametric methods
LDA was the worst performing of the implemented techniques throughout all of the scenarios considered in this paper. This is largely due to the linear decision boundary used by this algorithm which isn’t adequate to detect anomalies in this complex environment. QDA was at the opposite end of the spectrum outperforming all of the data-driven algorithms. It was so effective at detecting anomalies that the local anomaly detector didn’t improve its accuracy like it did with the other algorithms meaning that it was already detecting the anomalies uncovered by that technique. Unsurprisingly MD was always close behind QDA with the two algorithms reacting similarly to the different scenarios.
The biggest problem with these techniques is that they are rendered ineffective in high dimensional spaces. In this scenario, dimensionality reduction is going to play a huge role in determining whether or not they can be applied. Another issue is that unlike the other implemented techniques DA also requires negative example in the training process. The nature of anomaly detection problems also means that there is always going to be an imbalance of positive and negative examples. This unbalanced data problem is not an issue for QDA and no creative sampling of the dataset is required in order to yield good results. When the dataset has some negative examples for training and dimensionality is not an issue with the assumption of normality being reasonably met, QDA outperforms most algorithms.
Density-based algorithms
The Density-based algorithms had mixed results although they were mostly positive with their S scores never dropping below 0.8. Their \(F_1\) scores however weren’t as resilient when tested on the reduced and noisy datasets. This is largely due to the increased number of FPs flagged by these algorithms in those scenarios. LOF consistently outperformed SOD, which was specifically designed for high dimensional data, across all scenarios considered in this paper. As the dimensionality of the data increases the roles will gradually reverse to see SOD being the more accurate algorithm. This is why both algorithms were included in the proposed ensemble technique. The main disadvantage of these algorithms is that they are more computationally expensive than the other techniques.
OSVM
Centralised OSVM on its own did not have the best results as it was only able to outperform LDA and only scoring above the naive classifier in the reduced dataset where OSVM recorded a large number of FPs. The problem with OSVM is that it wasn’t sensitive enough to anomalies as can be seen from the extremely low number of FPs. Even though it was able to detect all 7 attacks, the performance metrics indicate that it didn’t perform well considering the entire attack window. The high PPV indicates that it usually flags the correct data and the low TPR indicates that it misses a lot of relevant samples. When paired with a local detector it was able to outperform the naive classifier but still wasn’t able to get either the S or \(F_1\) scores above 0.8.
Ensemble technique
The proposed technique looked to leverage the performance of QDA and the scalability of the density-based approaches. When the data is clean with a reasonably sized dataset it outperforms both LOF and SOD. When those two conditions are not met though it has either worse of comparable results to LOF which consistently had a better \(F_1\) score. This means that filtering data is paramount when applying this technique to noisy datasets in order to leverage the full benefits it has over the original methods. It is also important to have sufficient training samples as a larger dataset helps to draw a more accurate decision boundary which doesn’t suffer from overfitting.
In general though the ensemble technique had very promising results and when paired with a local detector it was able to achieve a comparable performance to plain QDA. The main advantage it has over plain QDA is the scalability when looking at the dimensionality of the feature space. In this particular dataset the dimensionality doesn’t cause multicollinearity problems so the performance of QDA is undisputed among the data-centric algorithms. In higher dimensional data QDA and by extension MD will not be applicable but the proposed algorithm, which always takes in only two features will not be affected in the same way. Like the density-based algorithms, the main disadvantage of this approach is also how computational expensive it is.
Conclusion
In this paper a number of traditional anomaly detection techniques were tested on the BATADAL dataset in different scenarios and compared to the algorithms proposed for the competition. The main focus was whether or not it’s possible to get accurate results when training the algorithms on the entire feature space in a centralised manner. An ensemble technique that uses both density-based techniques and QDA was also proposed and tested alongside the traditional techniques. The implemented algorithms had comparable results to the state of the art techniques developed for the competition. It was thus found that while it is possible to get accurate results using centralised training, the use of multi-stage techniques that isolates both local and global anomalies will generally yield better results. The proposed technique also had very promising results in the application scenario and outperformed both SOD and LOF in the original dataset. Future work is going to include testing the application of the proposed technique in high dimensional datasets.
References
Kim YG, Kim DH, Lee E-K (2017) Designing test methods for it-enabled energy storage system to evaluate energy dynamics. J Inform Process Syst 13(6):1431–1435
Colombo AW, Karnouskos S, Shi Y, Yin S, Kaynak O (2016) Industrial cyber-physical systems. Proc IEEE 104(5):899–903
Wang Z, Song H, Watkins DW, Ong KG, Xue P, Yang Q, Shi X (2015) Cyber-physical systems for water sustainability: challenges and opportunities. IEEE Comm Magaz 53(5):216–222
Uddin Z, Ahmad A, Qamar A, Altaf M (2018) Recent advances of the signal processing techniques in future smart grids. Human-centric Comput Inform Sci 8(1):2
Cheng B, Zhang J, Hancke GP, Karnouskos S, Colombo AW (2018) Industrial cyberphysical systems: realizing cloud-based big data infrastructures. IEEE Ind Electron Magaz 12(1):25–35
Janssen M, Anthopoulos L, Weerakkody V (2016) A unified smart city model uscm for smart city conceptualization and benchmarking. Int J Electron Govern Res 12(2):77–93
Ramotsoela D, Abu-Mahfouz A, Hancke G (2018) A survey of anomaly detection in industrial wireless sensor networks with critical water system infrastructure as a case study. Sensors 18(8):2491
Sharma PK, Moon SY, Park JH (2017) Block-vn: a distributed blockchain based vehicular network architecture in smart city. J Inform Process Syst 13(1):84
ICS-CERT (Industrial Control Systems-Cyber Emergency Response Team) (2014) NCCIC/ICS-CERT year in review: FY 2013. Washington, DC: US Dept. of Homeland Security., no. 13-50369
ICS-CERT (Industrial Control Systems-Cyber Emergency Response Team) (2015) NCCIC/ICS-CERT year in review: FY 2014. Washington, DC: US Dept. of Homeland Security., no. 14-50426
ICS-CERT (Industrial Control Systems-Cyber Emergency Response Team) (2016) NCCIC/ICS-CERT year in review: FY 2015. Washington, DC: US Dept. of Homeland Security., no. 15-50569
ICS-CERT (Industrial Control Systems-Cyber Emergency Response Team) (2017) NCCIC/ICS-CERT year in review: FY 2016. Washington, DC: US Dept. of Homeland Security., no. 16-50418
Miciolino EE, Setola R, Bernieri G, Panzieri S, Pascucci F, Polycarpou MM (2017) Fault diagnosis and network anomaly detection in water infrastructures. IEEE Design Test 34(4):44–51
Urbina DI, Giraldo JA, Tippenhauer NO, Cárdenas AA (2016) Attacking fieldbus communications in ics: applications to the swat testbed. In: SG-CRC, pp 75–89
Cardenas AA, Amin S, Sastry S (2008) Secure control: towards survivable cyber-physical systems. In: Distributed computing systems workshops, 2008. ICDCS’08. 28th international conference on. IEEE, pp 495–500
Taormina R, Galelli S, Tippenhauer NO, Salomons E, Ostfeld A (2017) Characterizing cyber-physical attacks on water distribution systems. J Water Resour Plan Manag 143(5):04017009
Slay J, Miller M (2007) Lessons learned from the maroochy water breach. Critical infrastructure protection, pp 73–82
Urbina DI, Giraldo JA, Cardenas AA, Tippenhauer NO, Valente J, Faisal M, Ruths J, Candell R, Sandberg H (2016) Limiting the impact of stealthy attacks on industrial control systems. In: Proceedings of the 2016 ACM SIGSAC conference on computer and communications security. ACM, pp 1092–1105
Taormina R, Galelli S, Tippenhauer N, Ostfeld A, Salomons E (2016) Assessing the effect of cyber-physical attacks on water distribution systems. In: World environmental and water resources congress 2016, pp 436–442
Cárdenas AA, Amin S, Lin Z-S, Huang Y-L, Huang C-Y, Sastry S (2011) Attacks against process control systems: risk assessment, detection, and response. In: Proceedings of the 6th ACM symposium on information, computer and communications security. ACM, pp 355–366
Souri A, Hosseini R (2018) A state-of-the-art survey of malware detection approaches using data mining techniques. Human-centric Comput Inform Sci 8(1):3
Taormina R, Galelli S, Tippenhauer NO, Salomons E, Ostfeld A, Eliades DG, Aghashahi M, Sundararajan R, Pourahmadi M, Banks MK (2018) Battle of the attack detection algorithms: disclosing cyber attacks on water distribution networks. J Water Resour Plan Manag 144(8):04018048
Christodoulou SE, Kourti E, Agathokleous A (2017) Waterloss detection in water distribution networks using wavelet change-point detection. Water Resour Manag 31(3):979–994
Kang J, Park Y-J, Lee J, Wang S-H, Eom D-S (2018) Novel leakage detection by ensemble cnn-svm and graph-based localization in water distribution systems. IEEE Trans Ind Electron 65(5):4279–4289
Moghaddass R, Wang J (2018) A hierarchical framework for smart grid anomaly detection using large-scale smart meter data. IEEE Trans Smart Grid 9(6):5820–5830
Li B, Lu R, Wang W, Choo K-KR (2017) Distributed host-based collaborative detection for false data injection attacks in smart grid cyber-physical system. J Parallel Distributed Comput 103:32–41
Esmalifalak M, Liu L, Nguyen N, Zheng R, Han Z (2017) Detecting stealthy false data injection using machine learning in smart grid. IEEE Syst J 11(3):1644–1652
Housh M, Ohar Z (2017) Model-based approach for cyber-physical attack detection in water distribution systems. In: World environmental and water resources congress. 2017, pp 727–736
Abokifa AA, Haddad K, Lo CS, Biswas P (2017) Detection of cyber physical attacks on water distribution systems via principal component analysis and artificial neural networks. In: World environmental and water resources congress 2017, pp 676–691
Giacomoni M, Gatsis N, Taha A (2017) Identification of cyber attacks on water distribution systems by unveiling low-dimensionality in the sensory data. In: World environmental and water resources congress 2017, pp 660–675
Brentan BM, Campbell E, Lima G, Manzi D, Ayala-Cabrera D, Herrera M, Montalvo I, Izquierdo J, Luvizotto E Jr (2017) On-line cyber attack detection in water networks through state forecasting and control by pattern recognition. In: World environmental and water resources congress 2017, pp 583–592
Chandy SE, Rasekh A, Barker ZA, Campbell B, Shafiee ME (2017) Detection of cyber-attacks to water systems through machine-learning-based anomaly detection in scada data. In: World environmental and water resources congress 2017, pp 611–616
Pasha MFK, Kc B, Somasundaram SL (2017) An approach to detect the cyber-physical attack on water distribution system. In: World environmental and water resources congress 2017, pp 703–711
Aghashahi M, Sundararajan R, Pourahmadi M, Banks MK (2017) Water distribution systems analysis symposium-battle of the attack detection algorithms (batadal). In: World environmental and water resources congress 2017, pp 101–108
Breunig MM, Kriegel H-P, Ng RT, Sander J (2000) Lof: identifying density-based local outliers. In: ACM sigmod record, vol. 29, no. 2. ACM, pp 93–104
Kriegel H-P, Kröger P, Schubert E, Zimek A (2009) Outlier detection in axis-parallel subspaces of high dimensional data. In: Pacific-Asia conference on knowledge discovery and data mining. Springer, Berlin. pp 831–838
Leys C, Klein O, Dominicy Y, Ley C (2018) Detecting multivariate outliers: use a robust variant of the mahalanobis distance. J Exp Soc Psychol 74:150–156
Shmueli G, Bruce PC, Yahav I, Patel NR, Lichtendahl KC Jr (2017) Data mining for business analytics: concepts, techniques, and applications in R. Wiley, New York
Khan SS, Madden MG (2014) One-class classification: taxonomy of study and review of techniques. Knowl Eng Rev 29(3):345–374
Hodge VJ, Austin J (2018) An evaluation of classification and outlier detection algorithms. arXiv preprint arXiv:1805.00811
Domingos P (2012) A few useful things to know about machine learning. Commun ACM 55(10):78–87
Pasqualetti F, Dörfler F, Bullo F (2013) Attack detection and identification in cyber-physical systems. IEEE Trans Autom Control 58(11):2715–2729
Chen J, Cao X, Cheng P, Xiao Y, Sun Y (2010) Distributed collaborative control for industrial automation with wireless sensor and actuator networks. IEEE Trans Ind Electron 57(12):4219–4230
Authors' contributions
All authors read and approved the final manuscript.
Acknowledgements
This work was supported by the Advanced Sensor Networks research group at the University of Pretoria.
Competing interests
The authors declare that they have no competing interests.
Availability of data and materials
Available upon request.
Publisher's Note
Springer Nature remains neutral with regard to jurisdictional claims in published maps and institutional affiliations.
Author information
Authors and Affiliations
Corresponding author
Rights and permissions
Open Access This article is distributed under the terms of the Creative Commons Attribution 4.0 International License (http://creativecommons.org/licenses/by/4.0/), which permits unrestricted use, distribution, and reproduction in any medium, provided you give appropriate credit to the original author(s) and the source, provide a link to the Creative Commons license, and indicate if changes were made.
About this article

Cite this article
Ramotsoela, D.T., Hancke, G.P. & Abu-Mahfouz, A.M. Attack detection in water distribution systems using machine learning. Hum. Cent. Comput. Inf. Sci. 9, 13 (2019). https://doi.org/10.1186/s13673-019-0175-8
Received:
Accepted:
Published:
DOI: https://doi.org/10.1186/s13673-019-0175-8