- Research
- Open access
- Published:
Rethinking self-reported measure in subjective evaluation of assistive technology
Human-centric Computing and Information Sciences volume 7, Article number: 23 (2017)
Abstract
Self-reporting is used as a subjective measure of usability study of technology solutions. In assistive technology research, more than often the ‘a coordinator’ directly assist the ‘subject’ in the scoring process. This makes the rating process slower and also introduces bias, such as, ‘Forer effect’ and/or ‘Hawthorne’ effect. To address these issues we propose to use technology mediated interaction between the ‘subject’ and ‘the coordinator’ in evaluating assistive technology solutions. The goal is to combine both the qualitative and quantitative scores to create a relatively unbiased rating system. Empirical studies were performed on two different datasets in order to illustrate the utility of the proposed approach. It was observed that, the proposed hybrid rating is relatively unbiased for usability study.
Introduction
Subjective evaluation of assistive technology solutions often has access to limited number of representative users in the rating process. Sometimes non- representative users (e.g. a blind folded person as blind) act as subject to increase the number. Most of the case same data collection process, self-reported measures (e.g. questioners) are used for both [1] groups of users. In the data collection process, representative users need to express their subjective opinion to data collector (facilitator). This can introduce cognitive bias and may hinder the relatively unbiased data collection. The intermediary assistance causes direct or indirect influence to the rating process and makes the rating process slower and less objective. It also affects the “privacy” and may have issues, such as ‘Forer effect’ [2] or ‘Hawthorne effect’ [3]. Figure 1 shows a schematic diagram of subjective data collection. A representative subject is participating in the rating process with the help of a ‘facilitator’. In step one, the facilitator may ask a question to the subject with subject’s preferred medium of instruction (audio, Braille etc.). The subject may understand the question (step 2) and answer with a subjective score (step 3) or may not able to answer due to medium or other problem. If subject answer the question, the next step of the facilitator is to record the score on behalf of subject (step 4) or repeat the question (if necessary changing the medium).

Subjective rating process in disability study (with representative user). Steps are shown in Charlie brackets
Self-reported measure suffers from predictive bias [4]. Use of the same measure in disability experiment is unreliable and affected by experimental biases [4]. To resolve bias issues, a paired comparison testing was reported in [5]—which is weighting the rating scores by subjects participated in the study. The paired comparison is unable to address underlying bias issue. We propose a technology mediated approach that includes subjective rating with user observation (secondary) to solve the existing problem. The rational to choose a hybrid approach is that removing some bias may improve the reliability of the subjective rating.
The hybrid approach aims to combine subjective rating (un-weighted) with weights given by experts. The indirect weight can be computed by experts’ analysis on post-experiment recorded video combining with subject’s ability profile. The hybrid approach combines the quantitative data from subjective rating and weighted qualitative analysis of rating validation on the video.
Two different cases were analyzed to show the utility of the proposed approach. The first experiment considers usability and mental workload analysis of blind subjects during interaction with RMAP [6] (reconfigured mobile android phone)—an android application to read printed text. The second experiment is a cross-disability communication experiment [7] performed to assess the mental workload of four participants in designing four different design of the same problem—different design mode of communication using android application and other devices. NASA-TLX rating scheme was used in both assessment [8].
We perform Cronbach alpha test [9] to ensure the reliability of the score and use a gradient descent algorithm to update the alpha score (weights) in the process of hybridization. We also apply Kano analysis [10], to see whether subjects are satisfied or not with the new rating process.
The rest of the paper is organized as follows. The “Background” summarizes reported works to set the context of research. The subsequent sections (“Research method” and “Results and discussion”) explain the proposed hybrid method with two experiments. Finally, “Conclusion” concludes the paper with lessons learned and future works.
Background
Little is known about the self-reported subjective measures with disable people. Dickinson et al. [11], describe self-reported Quality of Life (QoL) of children with cerebral palsy, factors that influence it, and how it compares with QoL of the general population. With relation to QoL, participation, and environment, White-Koning et al. [12], extended the subjective-evaluation with cerebral palsy study. A different rating scale is proposed in Stoyanov et al. research [13], claiming that the scale allows for the appropriate calculation of weighted values of rater agreement and accounts by quality subscale from the overall mean app quality score, due to its subjective nature. McFarland et al. [14] proposed a two-state process, means taking the rating what is common is considered as true rating. Likewise, Dai et al. [15] extends a rating scale considering the concept of the agency theory, which states that, the objective and subjective measures should be weighted equally. They proposed a model to weight subjective versus objective measures. Kilman et al. [16] proposes subjective ratings of masker disturbance during the perception of native and non-native speech, as an application of second language speaker. Very few of these are suitable in assistive technology usability evaluation. Hence, an ongoing demand for adaptive technology with qualitive and quantitative measures are comparative. Connection to that, a brief review on rating related metrics: the rating effects, rating bias, issues in un-bias rating and pair comparison approaches are reviewed as following:
Rating effects
The individual ratings are high for applications that are tailored to ones specific need. Such ratings are rarely useful and general enough to apply to a diverse population. The effect is known as ‘Forer effect’, or sometimes ‘Barnum Effect’ [2]. Some studies have found that subjects give higher accuracy ratings for three reasons: (a) the subject believes that the analysis applies only to him or her, and thus applies their own meaning to the statements [17], (b) the subject believes in the authority of the evaluator, and (c) the analysis lists mainly positive traits [2]. A closely general and related effect to the ‘Forer effect’ is the ‘subjective validation’; a person will consider a statement or another piece of information to be correct if it has any personal meaning or significance to them [1]. In disability data collection, the facilitator or interviewer assists the subject in the rating process. The subjects need to express his/her opinion in witness of the facilitator. The problem with this observation is well known Hawthorne effect [3]. Hawthorne effect affects subjective rating reflecting idealized rather than typical behavior.
Rating biases
Since stimulus bias has been shown to be substantially more effective with category ratings than with magnitude estimation, Pollack restricts examination to category rating scales [2]. There are a number of other biases worth mentioning for the sake of clarity and completeness.
-
1.
Cognitive bias [18]—A cognitive bias is a pattern of deviation in judgment which may be caused by inferences about other people and situations [1]. It may sometimes lead to perceptual distortion, inaccurate judgment, illogical interpretation, or what is broadly called irrationality and results an unsatisfactory rating. Cognitive bias arises from various processes that are sometimes difficult to distinguish. These include shortcuts (heuristics) during information-processing, mental noise and the mind’s limited information processing capacity, emotional and moral motivations, or social influence. [18]
-
2.
Construct bias [4]—It occurs when an experiment has different meanings for two groups, in terms of the precise construct that the test is intended to measure. It has to do with the relationship of observed scores to true scores on psychological test. If this relationship can be shown to be systematically different for different groups, then we might conclude that the test is biased. Construct bias can lead to situations in which two groups have the same average true score on a psychological construct but different test scores.
-
3.
Predictive bias [2]—It has to do with the relationship between scores on two different tests. One of these tests (the predictor test) is thought to provide values that can be used to predict scores on the other test (the outcome test or measure). For example, graduate admissions officers might use Graduate Record Examination (GRE) test scores to predict GPAs. The GRE would be the predictor test and GPAs would be the outcome measure. In this context, test bias concerns the extent to which the link between predictor test true scores and outcome test observed scores differ for two groups. If the GRE is more strongly predictive of GPA for one group than for another, then the GRE suffers from predictive bias, in terms of its use as a predictor of GPA.
Issues in unbiased rating
Friedman [17] examined issues involved in creating a relatively unbiased rating scale. These are: (1) connotations of category labels; (2) response alternative effects; (3) implicit assumptions of the question; (4) forced-choice vs. non-forced-choice rating scales; (5) unbalanced and balanced rating scales; (6) order effects; (7) direction of comparison; (8) optimal number of points; (9) context effects; (10) rating approach, e.g., improvement needed, performance, comparison to expectations, comparison to ideal, etc. These are briefly explained in Table 1.
Paired comparison approach
In cognitive psychology paired comparison technique works with pair-wise comparing entities to judge which of each entity is preferred, or has a greater amount of quantitative property [8]. The method of pair-wise comparison is used in the scientific study of preferences, attitudes, voting systems, social choice, public choice, and multi-agent AI systems. Suppose we have two mutually distinct alternatives x and y, the preference can be expressed as a pairwise comparison. For instance, the agent prefers x over y: “x > y” or “xPy”. The agent prefers y over x: “y > x” or “yPx”; or, agent is indifferent between both alternatives: “x = y” or “x|y”.
NASA-TLX
The NASA task load index (NASA-TLX) is developed by the Human Performance Group at NASA’s Ames Research Center [8]. NASA-TLX is a multidimensional subjective rating tool that rates perceived workload, in order to assess the task, system, or team’s effectiveness or other aspects of performance. Six sub-scales in NASA-TLX are mental demand, physical demand, temporal demand, performance, effort and frustration [8]. That applies paired comparison technique known as the weighted NASA-TLX method to resolve the bias issues [5]. It requires subject’s more (at least double) involvement in the rating process [23], which is not plausible in disability study context.
In our work, the hybridization process runs with subjects rating and post-rating analysis of the rating process (expert’s rating about rating).
Research method
To the best of our knowledge, either ‘Forer’ or ‘Hawthorne’ is not incorporated in any subjective rating system. To analyze these effects and bias in rating processes, we collect multidimensional data, rating data with quantitative and qualitative properties. For instance, with the subjective rating, user observation (recording video) and post-task interview are conducted for secondary (experts) evaluation and weight computation. A quantitative analysis may apply in rating scores. While the qualitative measures like—flow graph analysis, critical incidence, fact gathering may apply for weighting the subjective rating. The process is shown in Fig. 2.

Example-multidimensional data collection process [7]
A hybrid rating system combined with the Kano model in subjective data collection can provide a much needed objectivity and un-biased rating in the usability study. A case study is used to explain the processes in our laboratory experiment.
With multidimensional data, we apply Cronbach alpha [9] and Kano [10] analysis to gain perspective about user’s satisfaction score. Test failure of this analysis will necessitate the requirement of hybridization. Also, in the hybridization process we compute the weight from secondary or tertiary evaluation of data; the weight is updated if necessary and adjusted with rating scores. The process can be continued unless we have an acceptable alpha score and satisfaction score. The research steps are shown in Procedure 1.
Procedure 1: rating hybridization process
(1) Rating data pre-processing procedure |
(a) Selection of multidimensional rating data |
(b) Identifying qualitative and quantitative part |
(c) Identify statistical analysis |
(2) Rating effect and bias analysis |
(a) Reliability test—Cranach alpha test |
(b) User acceptance—Kano analysis |
(3) The hybridization_process |
(a) Weight computation—critical incidence analysis |
(b) Weight update—gradient decent delta rule |
(c) Scale improvement with weight |
Datasets
Two datasets are used in this study: (1) reconfigured mobile android phone (R-MAP) dataset [6] and (2) cross-disability communication dataset [7]. NASA-TLX data is considered as the rating data and the observation during data collection are coded with critical incidence analysis are considered as weights to modify the NASA-TLX. Brief descriptions of data sets are as following:
-
1.
R-MAP dataset—This study was conducted between two groups: representative and non-representative [5]. In the representative group, there were four blind people; two are non-expert, and two are expert. Expertness is considered based on their experience smart phone use experience for more than a year. The second study group (non-representative) contained twenty blindfolded participants; ten of them are considered an expert and the other ten participants are non-expert. Participants were trained and were asked to use the R-MAP to read different objects, documents that have text in it (e.g. texts from a text book). The data collection process is passed through the institutional review board. R-MAP subjective rating dataset uses the concept of the NASA task load index [8, 5] with six dimensions to assess mental workload: mental demand, physical demand, temporal demand, performance, effort, and frustration.
This dataset also contains five dimension usability scores: learnability, satisfaction, errors, efficiency and memorability [24]. R-MAP questioners are shown in Tables 2 and 3. Table 2 shows the description of NASA-TLX dimensions. Five step graded response scales are used to obtain ratings for these dimensions. A score from 0 to 10 is obtained on each scale. The six individual scale rating are combined using a weighting procedure (Table 4). A cumulative workload score from 0 to 1 is obtained for each rated task by multiplying the weight by the individual dimension scale score, summing across scales, and dividing by individual average score we normalized the score.
-
2.
Cross-disability communication dataset—The cross-disability dataset is more qualitative dataset than quantitative [7]. Four usability experts participated in a discussion of cross-disability communication improvement. A deaf (Doris), a blind (Bob) a deaf–blind (Debra) with a facilitator (Jon) set in that conversation. The naming convention (not the actual name) is used for the simplicity. The fifth person was instructed to record the conversation, which is later used in critical incidence analysis. A snapshot of the experimental setting is shown in Fig. 3.
Fig. 3 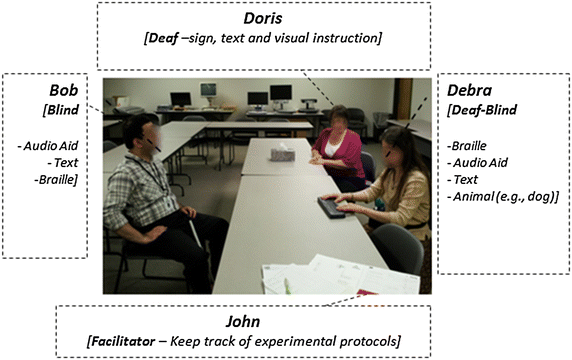
Cross-disability communication design experiment
In the whole conversation, four different types of communication design (to deaf vs. blind communication) were discussed. These four designs are: (1) speech-text-speech, (2) speech-sign-speech, (3) Braille-text-Braille and (4) Braille-sign-Braille. Figure 4 shows one such design between (Speech-sign-speech). The experiment is conducted without any time bound [25]. Through this process, NASA-TLX score was recoded for each design.
Fig. 4 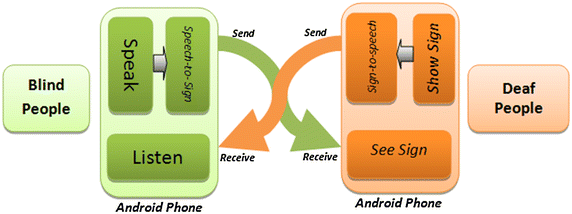
CD-2 (communication design-two: speech-sign-speech) conversation between Bob and Doris
CD-1 (communication design one-speech-text-speech) Speech from Bob can be encoded, then sent to Doris and she can read, and then text her reply with decoded as speech to Bob. Considerations: Bob cannot type, but speak and listen on the other hand Debra cannot speak or listen, but read text and type.
CD-2 (communication design two-speech-sign-speech) Speech from Bob can be encoded, then sent to Doris and played by the avatar to mimic the sign (ASL) to Doris, and finally Debra replays by the sign that is encoded to speech and sent back to Bob (Fig. 4). Considerations: Bob cannot type, but speak and listen on the other hand Doris cannot speak or listen, but read text and type.
CD-3 (communication design three speech-sign-speech) Braille from Bob can be encoded, then sent to Doris as text and she can read and reply text to Bob that is decoded to Braille again.
CD-4 (communication design four-speech-sign-speech) Braille from Bob can be encoded, then it can be sent to Doris and played by the avatar to mimic the sign (ASL) to Doris, and finally Doris replays by a sign, that is encoded to Braille and send back to Bob.


After each design discussion, they are asked to answer usability and cognitive load questioners (scored as 0–10 points). Same usability questionnaires (Table 3) and NASA-TLX (Table 2—modified in Table 5 for collaboration perspective) was used. These critical incidences (observations) are processed to find inherent causes and used to estimate weights of the expressed opinion.
Measurement
Alpha test
Cronbach’s alpha [9] is widely believed to be an indicator of the degree to which a set of items measures a single one-dimensional latent construct and useful in reliability testing of scores.
Cronbach’s alpha statistic is widely used in the social sciences, business, nursing, and other disciplines. Researchers investigate that alpha can take on quite high values even when the set of items measures several unrelated latent constructs [26, 27]. As a result, alpha is most appropriately used when the items measure different substantive areas within a single construct. Alpha can be artificially inflated by making scales which consist of superficial changes to the wording within a set of items or by analyzing speeded tests. In this case, alpha treats any covariance among items as true-score variance [26]. Alpha is not robust against missing data and in case of more than one construct. Coefficient omega or other may be more appropriate when the set of items measures more than one construct [28, 29].
Coefficient alpha is computed from the item variances with the ratio of variances as the sum of the n item variances divided by the total test variance.
Where, n = number of rating questions; \(\sigma_{I}^{2}\) = variance of score on each question; \(\sigma_{T}^{2}\) = variance of score in all questions.
Table 6 shows acceptable alpha scores.
Kano analysis
Kano analysis [10] is performed to get insight of user satisfaction in the rating process. It is a widely used usability tool that focuses on differentiating any features of the operation, as opposed to focusing initially on user’s needs. Kano also produced a methodology for mapping consumer responses to questionnaires onto his model which may be useful incorporating with a traditional rating system.
The adoption of Kano model for disability study is shown in the Fig. 5.

The Kano model [10]
The diagonal line (blue) indicates the one-dimensional expected need of the user. The curve in the bottom (red) indicates the user’s basic need which is known as a must-be requirement and the curve in the top (green) represents the excitement needs in terms of attractive requirement [10]. Dotted lines are used to represent scales of user acceptance and satisfaction. The horizontal dotted lines represent satisfaction and the vertical lines are aligned with user’s acceptance scores.
A pair of Kano questioners is shown in Table 7. Table 8 shows a Kano evaluation process.
The user satisfaction coefficient (US-coefficient)
The US-coefficient is indicative of how strongly a quality feature may influence satisfaction or, in case of it “non-fulfillment” user dissatisfaction. To calculate the average impact on satisfaction, it is necessary to add the attractive and one-dimensional columns and divide by the total number of attractive, one-dimensional, must-be and indifferent responses. For the calculation of the average impact on dissatisfaction, we add the “must-be” and “one-dimensional columns” and divide by the same normalizing factor (Eqs. 2 and 3). The scores are evaluated using the frequencies of criteria M > O > A > I and the equations below:
where, A = Attractive; M = Must be; R = Reverse; O = One dimensional; Q = Questionable result; I = Indifferent.
According to Kano explanation, the positive US-coefficient ranges from 0 to 1; the closer the value to 1, the higher the influence on user satisfaction. The minus sign in dissatisfaction Eq. (3) indicate negative influence on customer satisfaction if this product quality is not fulfilled. If the value of dissatisfaction approaches −1, the influence on customer dissatisfaction is especially strong, and product feature is not fulfilled. A value of about 0 signifies that this feature does not cause dissatisfaction. The satisfaction and dissatisfaction scores are based on the frequencies of M, O, A, I and R. Some rules can be followed which are known as evaluation rule. M > O > A > I must-be > one-dimensional > attractive > indifferent.
The quality improvement index (QI)
The QI is the ratio calculated by multiplying the relative significance of a usability requirement (self-stated importance) for the subject with the gap value of the facilitator rating scale in the questionnaire
where, RI = Relative importance, EF = evaluation of facilitator, and ES = evaluation of subject.
The value is indicative of how important the feature, service or process requirement is in terms of the quality improvement. The higher value in the positive range, the higher the relative improvement of quality form subjective viewpoint. However the higher negative values of this index, the higher the relative competitive disadvantage.
Critical incidence observation
Critical incidence combine (What + emotion + Why) from a given observation [30]. What—provides an in-depth description of the event and try to write it without judgment or interpretation. Emotions—describes the feelings the subject was ‘experienced’ with the incident. Why—explains why the incident was meaningful to us, and then put observer in the position of the subject and explains from their perspective why the incident was meaningful. critical incident analysis considers the position of observer-What is some of his personal beliefs related to expert knowledge that he/she identified when reflecting on this incident? After considering this incident, what he/she would do differently in light of new understanding? The hybrid approach encompasses the un-weighted NASA-TLX system and experts rating (weights) on the recorded videos. The matters of considerations are subjective experiences, functional states, task difficulty and time pressers [31]. The weight range considered (5-1 scale) as like Table 4.
Gradient descent rule
Gradient descent search can be performed to reduce the error in critical incident analysis through adjustments of weights [32].
where, D (w) is the gradient and η is the learning rate (small, positive). This moves us downhill in direction D (
w
) (steepest downhill direction), how far we go is determined by the value of η and the critical incidence learning rule may be an especially case of this general gradient descent rule. The algorithm is as flowing: 
Gradient descent rule needs a number of assumptions to be satisfied in order to succeed in convergence. To keep it simple for wide range of readers from different disciplines, we computed the initial value 0.5, the average of normalized maximum (1.00) and minimum (0.00) possible value ((1.00 + 0.00)/2). Total number of iteration required to converge will be sensitive to initial value. For instance, we start with 0.5 as the initial weight and performed five iterations, which are shown in result section (Table 11).
Results and discussion
In order to assess the reliability of collected subjective NASA-TLX scores, we apply the alpha test in two datasets. Alpha test results on R-MAP dataset and Cross-disability communication dataset are shown in Tables 9 and 10, respectively. It was observed from Table 9, that R-MAP dataset has an acceptance result (>0.80 which is >0.7). This is consistent in both mental workload and usability assessment.
The problem of data reliability takes part in cross-disability data analysis. In un-weighted cross-disability NASA-TLX, all scores lose reliability in terms of alpha (Table 10). Alpha in weighted NASA-TLX (weighted by subject) shows the worst reliability score of all datasets.
In the secondary analysis of traditionally collected data, facilitators scored for Kano analysis. The collection of satisfaction and dissatisfaction scores can be as following. Along with the usability data collection procedure, like with a question “How easy it was for a user to accomplish basic tasks at the first time?”, facilitator might observe how do the subject feel while answering a satisfactory score of the question. The facilitator can score about that score in (0.0–1.0 scale). Facilitators may arbitrarily consider fair or poor scores. For instance, let x (max value = 10) be the score to be considered by the facilitator. If x > 6, it can be considered as a good score. if x < 4 a poor score, score 4–6 may be ignored-the means the original score is good, and there is no need to change. Similarly, for the dissatisfaction score, the facilitator may score for how does the subject feel while answering a poor score of the question “How easy it was for a user to accomplish basic tasks at the first time?” Figure 6 shows a simulation result of the five usability scores in term of Kano model.

a Kano model representation of usability score as user satisfaction (US) coefficient; b a quality improvement index
User satisfaction coefficient (US-coefficient) plot is shown in Fig. 6a. A positive US-coefficient which approaches 0 signifies that there is very little influence. Again, the negative US-coefficient −1 indicates that the influence on user satisfaction is especially strong if the analyzed usability feature is not fulfilled. A value of 0 signifies that this feature does not cause dissatisfaction if it is not met. Finally, the quality improvement index can be computed as Fig. 6b, which will give more inside on acceptance or decline of futures in existing design. In existing data, it is found that, with some disadvantages, users accepted two usability features (Q1) and acknowledges three irrelevant features (Q3). A Matlab simulation was performed (delta rule) on experts predicted weights with some initial values with Kano observation of user satisfaction. The initial weight for all load types is assigned 0.50, assuming the average of the possible maximum (1.00) and minimum (0.00) values. Updated weight is applied to modify the user expressed score. The alpha test is applied on the data and checked its reliability. This process continued until we have a reliable score (0.0–0.7). The final weights and alpha score of modified dataset are shown in Tables 11 and 12. The generated weights are computed from maximum fifth iteration.
Conclusion
Subjective rating scales are used quite frequently in almost every aspect of research and practice for the assessment of workload, fatigue, usability, annoyance and comfort, and lesser known qualities such as urgency and presence [30]. The biased data can impede the actual need of target user and inferences obtained may not reveal the true nature of the problem leading to poor acceptances to target community. But, in disability research, same methods are being used for a long time with the help of an interpreter/moderator-facilitator. We tried to show the issues related to data reliability and acceptability of such rating system in disability study.
The hybrid approach, with alpha score and Kano model, can be used to distinguish relevant (acceptable) rating from irrelevant (un-acceptable) ratings and to find the best possible rating on incremental and adaptive rating tasks. The hybrid algorithm also can be used to find appropriate biases that can result in a dramatic reduction in error. The hybrid approach achieves this while requiring only a linear increase in computation by roughly a factor of two over plain least-square method.
The proposed hybrid approaches have several benefits in all aspects of usability engineering—reliability and user acceptability. According to the reviewer, the idea has found applications in other research/applied practices, for instance Credit Rating Agencies (e.g. Standard and Poor’s, etc.) are using in parallel qualitative and quantitative methodologies for providing their scores. It is expected to help to gain a better understanding of exact subjective need, prioritizing needs for development activities, distinguishing end users demand, adding the design trade-off process.
Although disability research is mostly user centric, Kano evaluation in the disability rating acceptance might give a better understanding the characteristics of disability actual needs and to get natural requirements in assistive technology design. The gradient descent based weight updating of critical incidence scores are proposed as a new approach in qualitative weight adjustment.
In summary, this research combines the qualitative (using the gradient descent rule) and quantitative score to create a relatively unbiased rating system. This work deals with the analysis of ‘Forer’ and ‘Hawthorne’ effects in a subjective rating system. They propose a relatively hybrid unbiased rating system. Cronbach alpha test is used to ensure the reliability of the score and a gradient descent algorithm is used to update the alpha score. Kano analysis has also been used to see if the subjects are satisfied with the new rating process. This hybridization will be compared with other mechanisms in the future.
References
Sears A, Hanson VL (2012) Representing users in accessibility research. ACM Trans Access. Comput 4(2):7. doi:10.1145/2141943.2141945
Dickson DH, Kelly IW (1985) The ‘Barnum Effect’ in personality assessment: a review of the literature. Psychol Rep 57(1):367–382
Parsons HM (1991) Hawthorne: an early OBM experiment. J Org Behav Manag 12(1):27–43
Brown RT, Reynolds CR, Whitaker JS (1999) Bias in mental testing since bias in mental testing. Sch Psychol Q 14(3):208
Hart SG (2006) NASA-task load index (NASA-TLX); 20 years later. In Proceedings of the human factors and ergonomics society annual meeting. Sage Publications, Thousand Oaks, pp 904–908
Hossain G, Shaik AS, Yeasin M (2011) Cognitive load and usability analysis of R-MAP for the people who are blind or visual impaired. In Proceedings of the 29th ACM international conference on design of communication. ACM, New York, pp 137–144
Hossain G, Yeasin M (2013) Collaboration gaps in disabilities sensemaking: Deaf and blind communication perspective”, Proceedings of the ACM conference on computer supported cooperative work (CSCW) CIS Workshop 2013, Feb 24, 2013, San Ontario
Hart SG, Staveland LE (1988) Development of NASA-TLX (task load index): results of empirical and theoretical research. Hum Mental Workload 1(3):139–183
Cronbach LJ (1951) Coefficient alpha and the internal structure of tests. Psychometrika 16:297–333
Kano N, Seraku N, Takahashi F, Tsuji S (1984) Attractive quality and must-be quality. J Jpn Soc Qual Control 14(2):39–48
Dickinson HO, Parkinson KN, Ravens-Sieberer U, Schirripa G, Thyen U, Arnaud C, Beckung E, et al. (2007) Self-reported quality of life of 8–12-year-old children with cerebral palsy: a cross-sectional European study. Lancet 369(9580):2171–2178
White-Koning M, Arnaud C, Bourdet-Loubère S, Bazex H, Colver A, Grandjean H (2005) Subjective quality of life in children with intellectual impairment—how can it be assessed? Dev Med Child Neurol 47(4):281–285
Stoyanov SR, Hides L, Kavanagh DJ, Zelenko O, Tjondronegoro D, Mani M (2015) Mobile app rating scale: a new tool for assessing the quality of health mobile apps. JMIR mhealth uhealth 3(1):e27
McFarland DJ, Parvaz MA, Sarnacki WA, Goldstein RZ, Wolpaw JR (2016) Prediction of subjective ratings of emotional pictures by EEG features. J Neural Eng 14(1):016009
Dai NT, Kuang X, Tang G (2016) Differential weighting of objective versus subjective measures in performance evaluation: experimental evidence. Eur Accounting Rev pp 1–20. doi:10.1080/09638180.2016.1234402
Kilman L, Zekveld AA, Hällgren M, Rönnberg J (2015) Subjective ratings of masker disturbance during the perception of native and non-native speech. Front Psychol 6:1065
Friedman HH, Amoo T (1999) Rating the rating scales. J Mark Manag 9(3):114–123
Krantz S, Hammen CL (1979) Assessment of cognitive bias in depression. J Abnorm Psychol 88(6):611
Marks DF (2000) The psychology of the psychic, 2nd edn. Pro-metheus Books, New York
Andrich D (1978) A rating formulation for ordered response categories. Psychometrika 43:357–374
Annett J (2002) Subjective rating scales: science or art? Ergonomics 45(14):966–987
Pollack I(1965) Iterative techniques for unbiased rating scales. Q J Exp Psychol 17(2):139–148
Krauss-Whitbourne, S (2012) When it comes to personality tests, skepticism is a good thing. Psychol Today. https://www.psychologytoday.com/blog/fulfillment-any-age/201008/when-itcomes-personality-tests-dose-skepticism-is-good-thing. Accessed 25 Nov 2012
Nielsen J (1992) The usability engineering life cycle. Computer 25:12–22
Kantowitz BH, Roediger HLIII, Elmes DG (2009) Experimental psy-chology. Cengage Learning, Boston
Schmitt N (1996) Uses and abuses of coefficient alpha. Psychol Assess 8:350–353. doi:10.1037/1040-3590.8.4.350
Zinbarg R, Yovel I, Revelle W, McDonald R (2006) Estimating generalizability to a universe of indicators that all have an attribute in common: a comparison of estimators for alpha. Appl Psychol Meas 30:121–144. doi:10.1177/0146621605278814
Zinbarg R, Revelle W, Yovel I, Li W (2005) Cronbach’s, Revelle’s, and McDonald’s: their relations with each other and two alternative conceptualiza-tions of reliability. Psychometrika 70:123–133. doi:10.1007/s11336-003-0974-7
Dunn TJ, Baguley T, Brunsden V (2013) From alpha to omega: a prac-tical solution to the pervasive problem of internal consistency estimation. Br J Psychol. doi:10.1111/bjop.12046
Redpath L, Stacey A, Pugh E, Holmes E (1997) Use of the critical incident tech-nique in primary care in the audit of deaths by suicide. Qual Health Care 6(1):25–28
Thurstone LL (1927) A law of comparative judgement. Psychol Rev 34:278–286
Russell I (2012) The delta rule. University of Hartford, West Hartford. Accessed 5 Nov 2012
Acknowledgements
This project was partially funded by National Science Foundation (NSF-IIS-0746790), USA. We greatly acknowledge to Clovernook Center for the Blind and Visually Impaired, Memphis TN, USA, Especially to Mr. Majid Khan for continuous cooperation. We also greatly acknowledge reviewers encouraging comments and valuable suggestions in updating different parts of the paper.
Competing interests
The author declares that he has no competing interests.
Publisher’s Note
Springer Nature remains neutral with regard to jurisdictional claims in published maps and institutional affiliations.
Author information
Authors and Affiliations
Corresponding author
Rights and permissions
Open Access This article is distributed under the terms of the Creative Commons Attribution 4.0 International License (http://creativecommons.org/licenses/by/4.0/), which permits unrestricted use, distribution, and reproduction in any medium, provided you give appropriate credit to the original author(s) and the source, provide a link to the Creative Commons license, and indicate if changes were made.
About this article

Cite this article
Hossain, G. Rethinking self-reported measure in subjective evaluation of assistive technology. Hum. Cent. Comput. Inf. Sci. 7, 23 (2017). https://doi.org/10.1186/s13673-017-0104-7
Received:
Accepted:
Published:
DOI: https://doi.org/10.1186/s13673-017-0104-7